We were fabricating MEMS pressure sensors in our research facility, UTARI, by using inkjet printing technique. We tried different recipes in order to come up with better flexible pressure sensor. The experiment had four distinct steps:
- Sensor fabrication
- Interfacing sensors
- Testing sensors
- Interface sensors with robots to conduct pHRI experiments
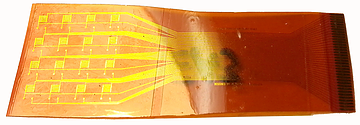
Sensor Fabrication
The printing setup, a cartesian robot, is controlled by A3200 Motion controllers system, using LabVIEW. The sensor testbed setup is consists of Newport actuator, controlled by cRIO, a National Instrument FPGA hardware, using LabVIEW.

The video shows an EHD printing process. EHD printing method creates electric field to get fluid out of a nozzle. Electric field generates well-proportioned jetting which in turn helps to get smallest feature by an order of magnitude below the nozzle size .
Nozzle has an ink chamber. Pressure is applied to the ink chamber and fluid meniscus is formed at nozzle tip. A high voltage is connected with the nozzle and ground is connected with the substrate to create electric filed between nozzle and substrate.
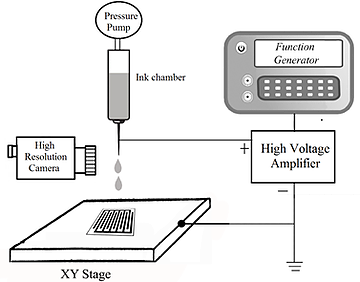
Figure above shows a standard setup for EHD printing. The main reason to use EHD printing is it supports wide range of materials. And it can print high viscosity materials e.g. up to 1000cP, as opposed to 50cP from conventional piezoelectric printing.
A calibration process was implemented in LabVIEW following the work done by Dr. Das.

Figure: Calibration Process
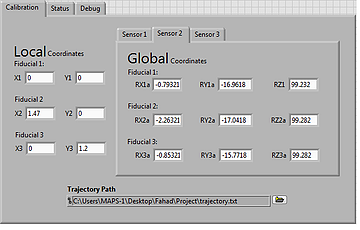
Figure: Calibration Interface on LabView
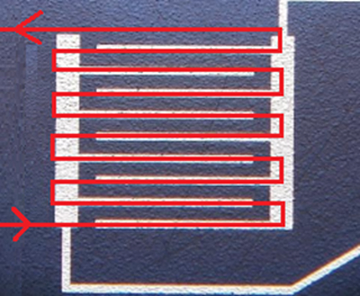
Figure: Printing Trajectory
Snippet of the LabVIEW front panel and the trajectory is shown above. The trajectory is shown for single structure can be expand to cover an array.
Interfacing Sensor
A custom made electronic board, named SkinCell, was designed to interface the sensors with ROS.
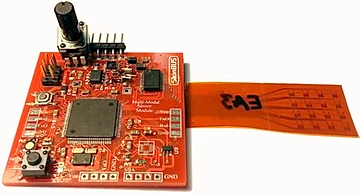
The board consist of an AVR microcontroller, ATmega2560. The block diagram of the board is shown below. The sensor has similar functionalities as a strain gauge. Commercially strain gauges are used with Wheatstone bridge and an instrumentation amplifier. Our sensor array, which has a dimension of 15.806mm x 14.58mm, consists of 16 structures. It is impractical to use 16 Wheatstone bridge - instrumentation amplifier setup.
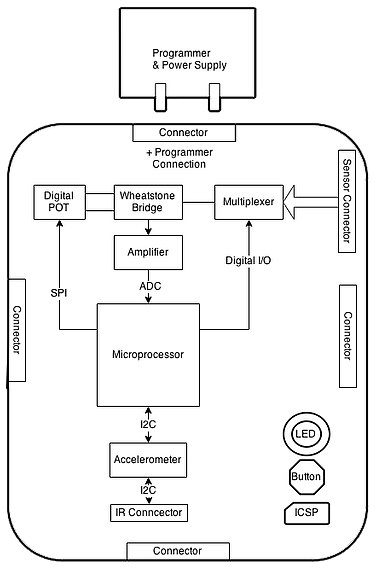
That’s why an analog multiplexer was used to connect those with the Wheatstone bridge one at a time. Also as different structures have different resistance value, we used a digital potentiometer, AD5174, to balance out the bridge. It is a 10KΩ POT with 1024 position and can be configured by SPI communication protocol.
Each SkinCell can process four of the 16-by-16 arrays and each SkinCell will communicate with its adjacent four Skincells through USART (four UART connectors on four sides).
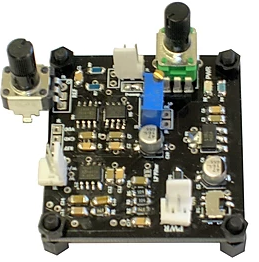
To test single structure sensor another custom board was designed containing power supply regulator, Wheatstone bridge with dummy sensor, instrumentation amplifier and a Butterworth filter with Sellen key topology.
Testing Sensor
Testing these sensor requires a better set of equipment that has high resolution analog-to-digital converter, susceptible to noise and can collect data real time. We used National Instruments real-time FPGA hardware, compactRIO (cRIO), controlled by the software package, LabVIEW.
cRIO is re-configurable and deterministic hardware that can programmed by LabVIEW. It has a 400MHz processor and 8 slots for swappable devices.
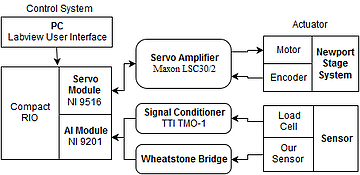
Figure: Block Diagram of Test Setup
Temperature and Humidity Sensitivity
To measure temperature and humidity, I used HTU21D that can measure both. The results are shown below. The red line represents the average of all 16 structures.
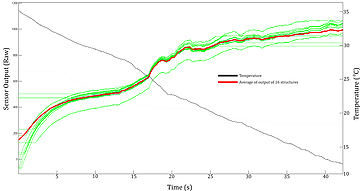
Figure: Temperature Sensitivity
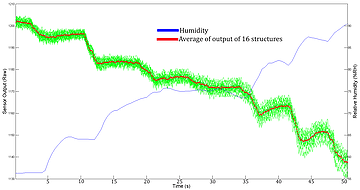
Figure: Humidity Sensitivity

Figure: Repeatable