Microsoft joined the world of IoT with its Azure IoT Suite. I could not wait to test it. They have a couple of Starter Kits for beginners that include Adafruit’s Feather, Sparkfun’s Thing, Raspberry Pi, Intel Edison, etc. You don’t need those starter kits if you already have any of those standalone development boards.
The Getting Started Guide can be found here, but I prefer the Github’s Getting Started Guide. At the time of writing, the former tutorial wasn’t updated.
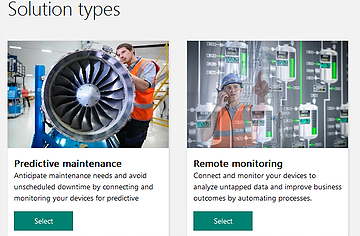
There are two examples on the official page. I will be exploring Simple Remote Monitoring using Sparkfun’s Thing Dev. The official tutorial uses RHT03 temperature+humidity sensor. I will be using HTU21D temperature+humidity sensor, which uses I2C.
Note: You’ll need Arduino 1.6.8 or later to follow this tutorial.
Azure IoT Suite
- Click on ‘Free trial’. If you don’t have a Microsoft account, you should create one now. You can use any of your existing email addresses. Next, it will ask you to fill up some information.

- Although they’ll ask for debit/credit card information, for verification, they won’t charge you anything. After your $200 they will disable the service and won’t charge you automatically unless you explicitly upgrade the plan. So, don’t worry. Once you are done, you’ll see something like this:
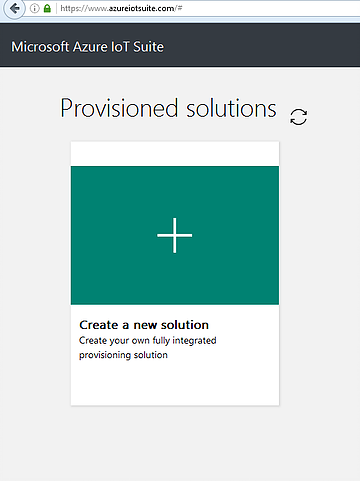
- Click on ‘+’. Select Remote Monitoring.
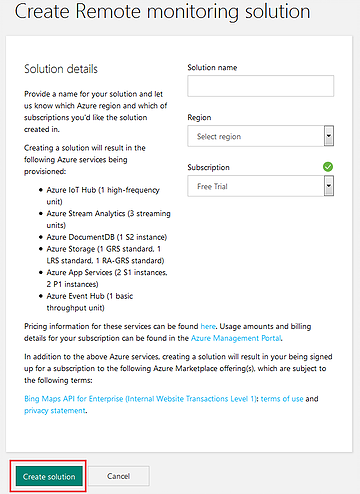
- Fill up the form. Choose a unique name. Choose your region. Choose Free Trial in the Subscription field. Then click ‘Create Solution’.
- It can take up to 10 mins. Wait until it is done.
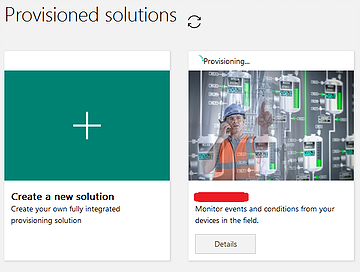
- Once it is done it should look like below. If you click on your solution (red +), the right window will pop up.
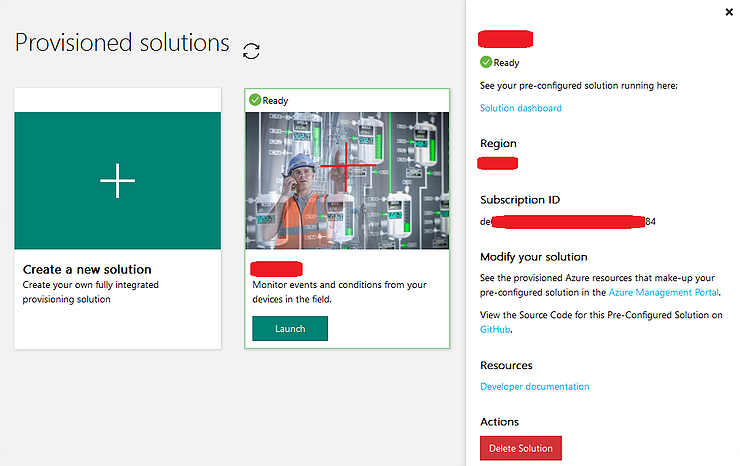
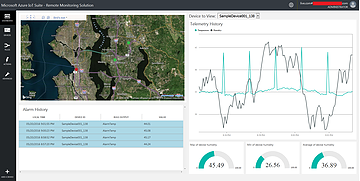
- If you click ‘Launch’, it might ask you to sign in again. Nevertheless, it will take you to the ‘Microsoft Azure IoT Suite - Remote Monitoring Solution’ Dashboard.
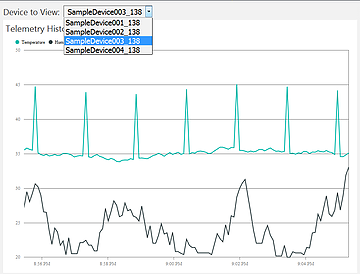
- If you click on ‘Device to View’ you’ll see some Sample Devices. These devices do not represent any physical real-world devices. These are more like imaginary devices with fabricated data (the graph) to give you a feel of how real-world hardware will work. I will show you later how to create sample devices. The idea is you can create a sample device with automated data generation and work on the Azure IoT Suite. Once you are finished with the web interface you can replace sample devices with actual hardware.
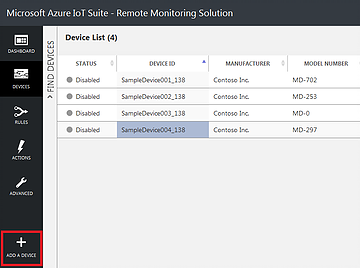
- Now click on ‘DEVICES’. It will have all those four sample devices. It is better to disable all these because these services will cost you (from $200 you got for a free trial).
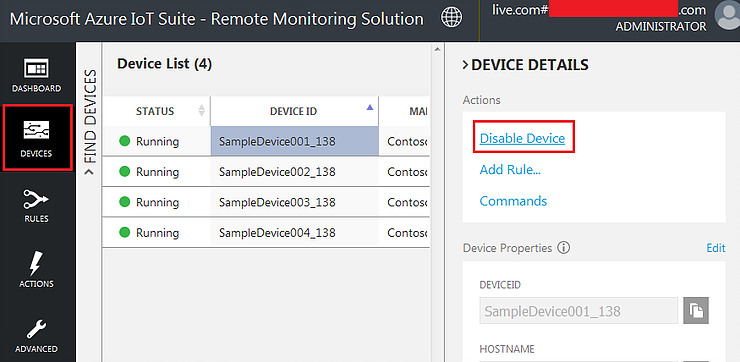
- Once you disable it, there will be an option to delete it. You can do so if you think you won’t need it, which what I did. After that, click on “ADD A DEVICE” at the bottom of the page.
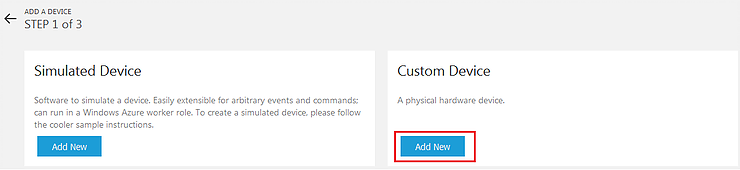
- Click on ‘Add New’ under Custom Device and type a device ID.

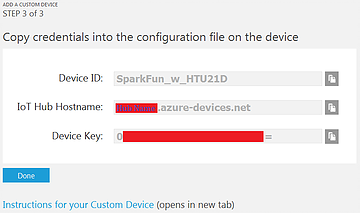
- If you click on ‘Create’ it will generate device credentials in step 3. Keep a note of these, preferably on a notepad.
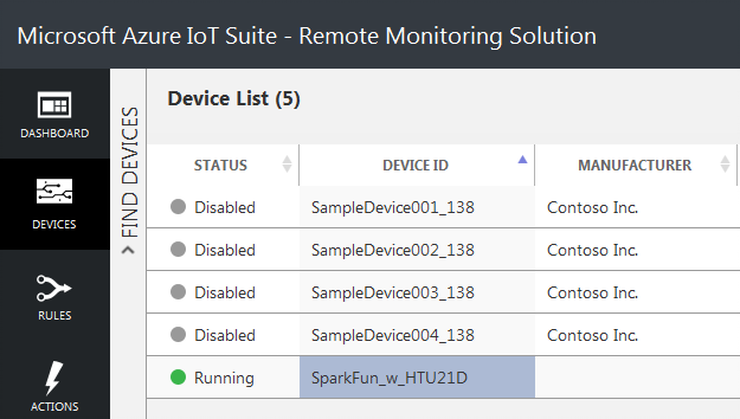
- The device you just created will show up in your device list. Now you can enable this device.
Hardware

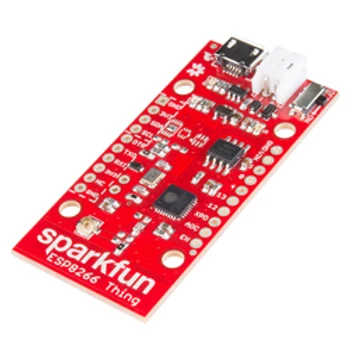
- HTU21D uses I2C for communication. Hardware Connections are shown below (HTU21D to Thing Dev):
| HTU21D Pins | Thing Pins |
|---|---|
| VCC | 3.3V |
| GND | GND |
| SDA | PIN2 |
| SCL | PIN14 |
- I modified the Microsoft’s code. If you use HTU21D, it will be better if you use my example. Run “remote_monitoring.ino”. Change SSID and password with your Wi-Fi SSID and password.
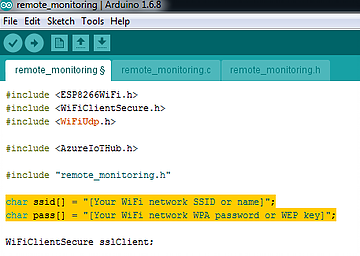
- Change the highlighted variables from “remote_monitoring.c”. In the place of ‘hubName’ just use the name of the hub you chose. For instance if your IoT Hub Hostname is “fahad.azure-devices.net”, use ‘fahad’ as your ‘hubName’.

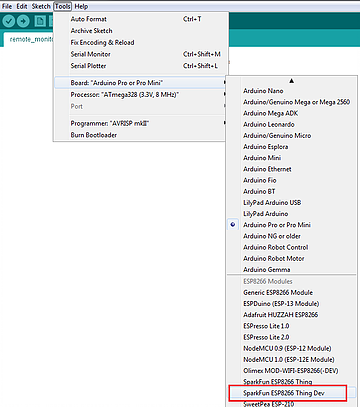
- Don’t forget to choose the right board.
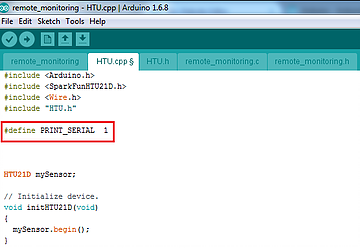
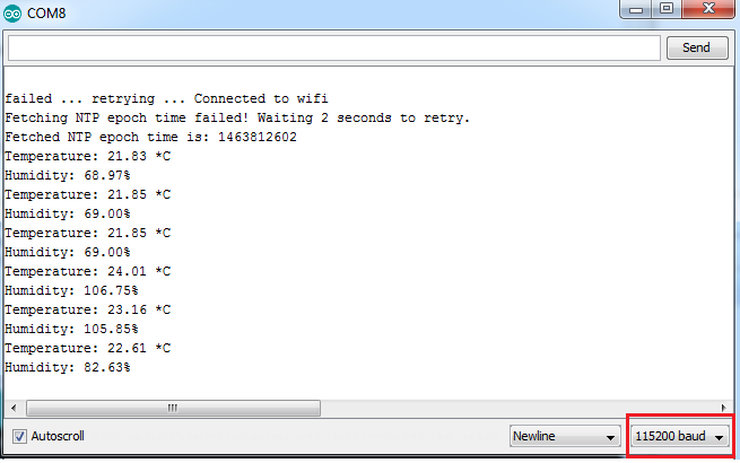
- If you define ‘PRINT_SERIAL’ as one from HTU.cpp, then after you load the code open the Terminal. Choose 115200 baud [if you haven’t changed already from setup() function]. It will display the sensor data.
Azure IoT Dashboard
- Let’s get back to the Azure Dashboard. Enable the device.
- Now go back to dashboard. As I disabled all other sample devices, ‘Device to View’ only shows one running device. Once you choose that data will start to appear on the graph.

- Blow on the sensor, or put a finger on the sensor and see the changes on the graph.